

Building products installation services company Installed Building Products (NYSE:IBP) beat Wall Street’s revenue expectations in Q2 CY2025, with sales up 3.1% year on year to $760.3 million. Its non-GAAP profit of $2.95 per share was 23% above analysts’ consensus estimates.
Is now the time to buy Installed Building Products? Find out by accessing our full research report, it’s free.
Installed Building Products (IBP) Q2 CY2025 Highlights:
- Revenue: $760.3 million vs analyst estimates of $712.4 million (3.1% year-on-year growth, 6.7% beat)
- Adjusted EPS: $2.95 vs analyst estimates of $2.40 (23% beat)
- Adjusted EBITDA: $134 million vs analyst estimates of $114.1 million (17.6% margin, 17.4% beat)
- Operating Margin: 13.3%, in line with the same quarter last year
- Free Cash Flow Margin: 9.8%, up from 7.9% in the same quarter last year
- Organic Revenue was flat year on year (4.8% in the same quarter last year)
- Market Capitalization: $5.81 billion
Company Overview
Founded in 1977, Installed Building Products (NYSE:IBP) is a company specializing in the installation of insulation, waterproofing, and other complementary building products for residential and commercial construction.
Revenue Growth
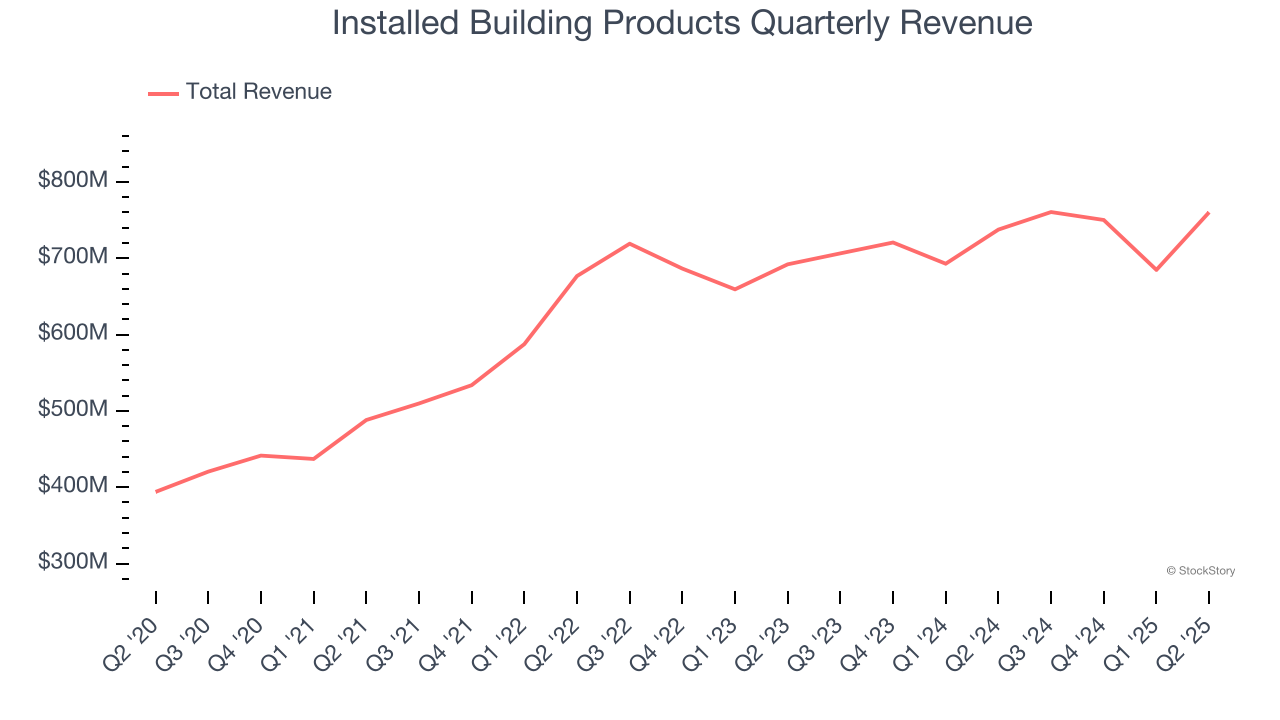
Reviewing a company’s long-term sales performance reveals insights into its quality. Any business can have short-term success, but a top-tier one grows for years. Luckily, Installed Building Products’s sales grew at an excellent 13.2% compounded annual growth rate over the last five years. Its growth beat the average industrials company and shows its offerings resonate with customers.
We at StockStory place the most emphasis on long-term growth, but within industrials, a half-decade historical view may miss cycles, industry trends, or a company capitalizing on catalysts such as a new contract win or a successful product line. Installed Building Products’s recent performance shows its demand has slowed significantly as its annualized revenue growth of 3.5% over the last two years was well below its five-year trend. 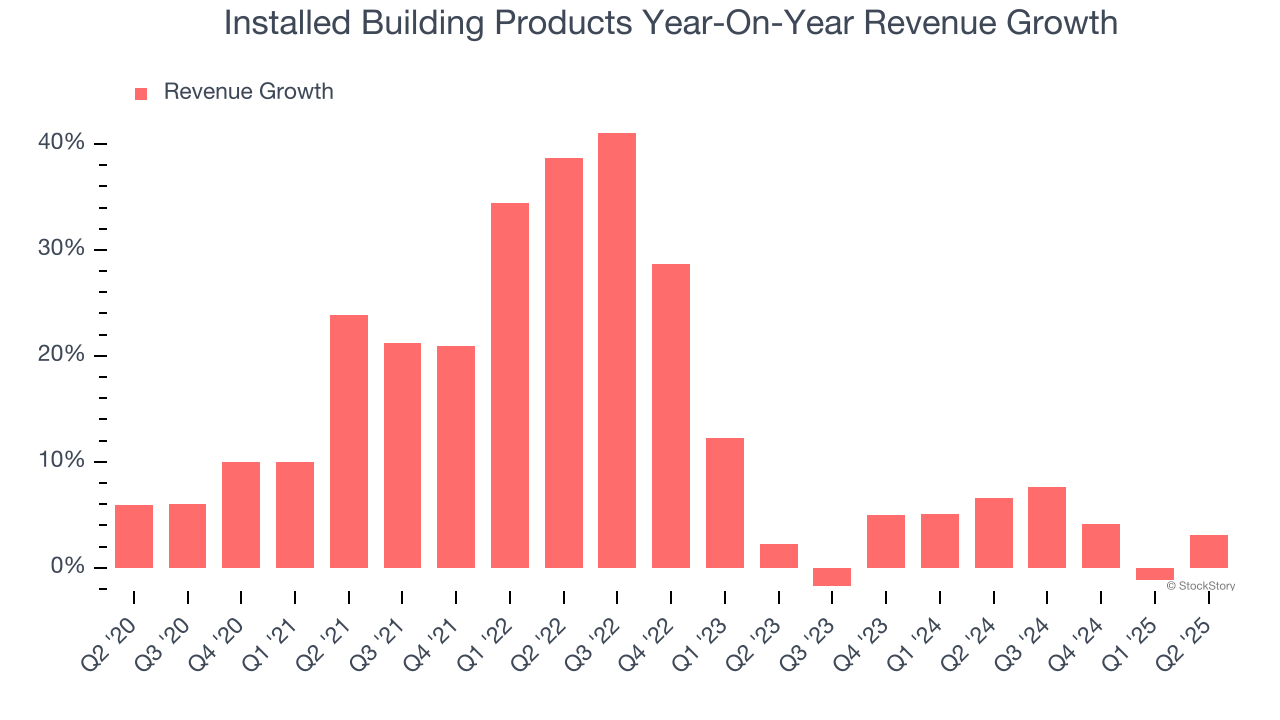
Installed Building Products also reports organic revenue, which strips out one-time events like acquisitions and currency fluctuations that don’t accurately reflect its fundamentals. Over the last two years, Installed Building Products’s organic revenue was flat. Because this number is lower than its two-year revenue growth, we can see that some mixture of acquisitions and foreign exchange rates boosted its headline results. 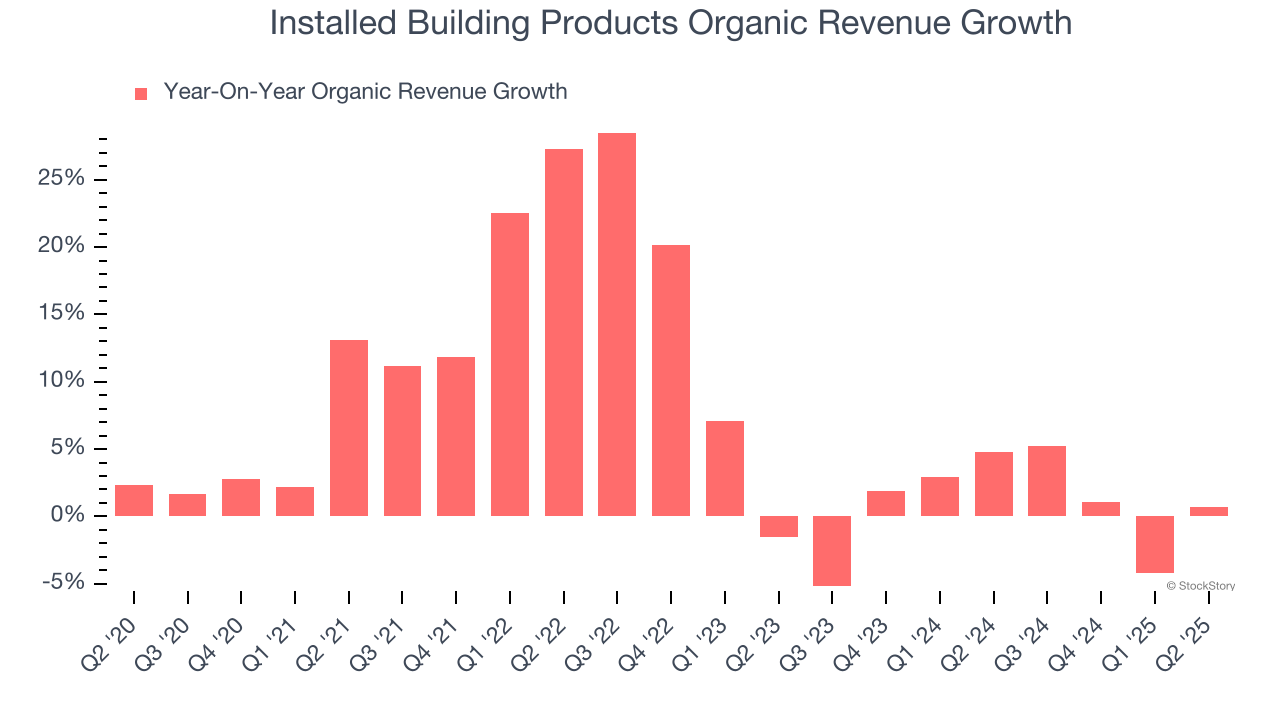
This quarter, Installed Building Products reported modest year-on-year revenue growth of 3.1% but beat Wall Street’s estimates by 6.7%.
Looking ahead, sell-side analysts expect revenue to decline by 4.2% over the next 12 months, a deceleration versus the last two years. This projection doesn't excite us and implies its products and services will see some demand headwinds.
Unless you’ve been living under a rock, it should be obvious by now that generative AI is going to have a huge impact on how large corporations do business. While Nvidia and AMD are trading close to all-time highs, we prefer a lesser-known (but still profitable) stock benefiting from the rise of AI. Click here to access our free report one of our favorites growth stories.
Operating Margin
Installed Building Products has been an efficient company over the last five years. It was one of the more profitable businesses in the industrials sector, boasting an average operating margin of 12.2%.
Analyzing the trend in its profitability, Installed Building Products’s operating margin rose by 2.7 percentage points over the last five years, as its sales growth gave it operating leverage.
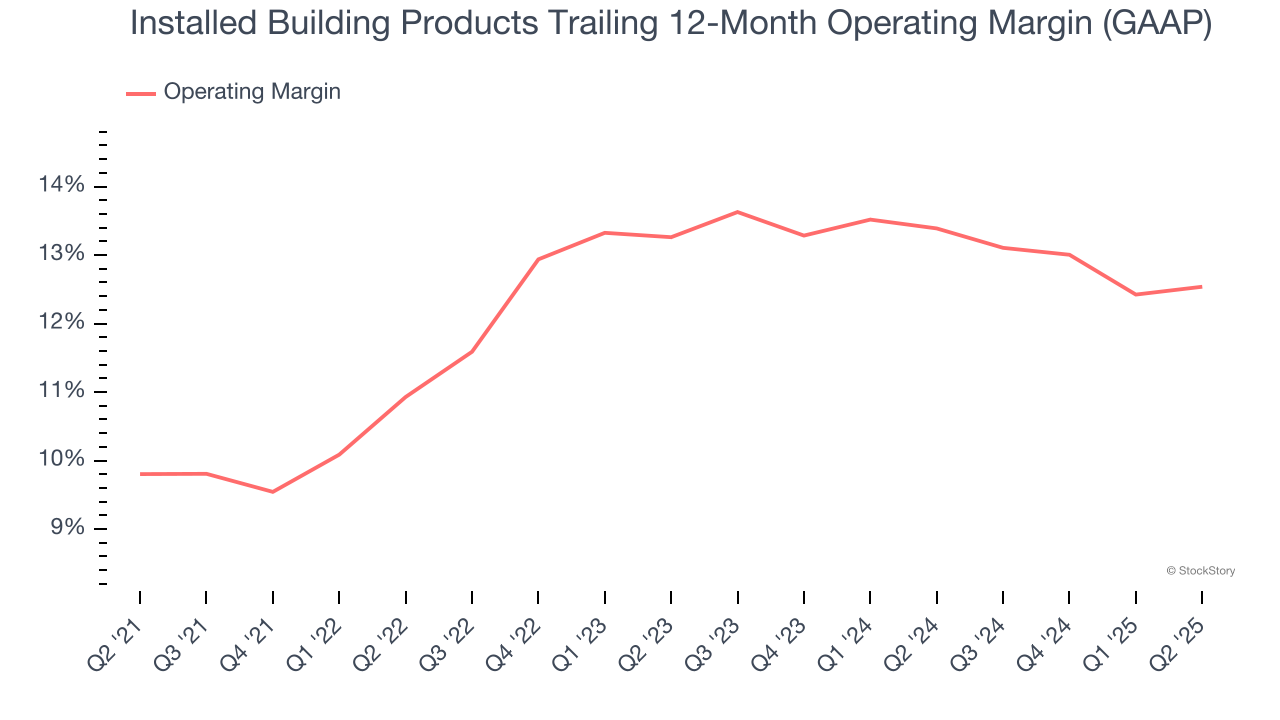
This quarter, Installed Building Products generated an operating margin profit margin of 13.3%, in line with the same quarter last year. This indicates the company’s cost structure has recently been stable.
Earnings Per Share
Revenue trends explain a company’s historical growth, but the long-term change in earnings per share (EPS) points to the profitability of that growth – for example, a company could inflate its sales through excessive spending on advertising and promotions.
Installed Building Products’s EPS grew at an astounding 23.1% compounded annual growth rate over the last five years, higher than its 13.2% annualized revenue growth. This tells us the company became more profitable on a per-share basis as it expanded.
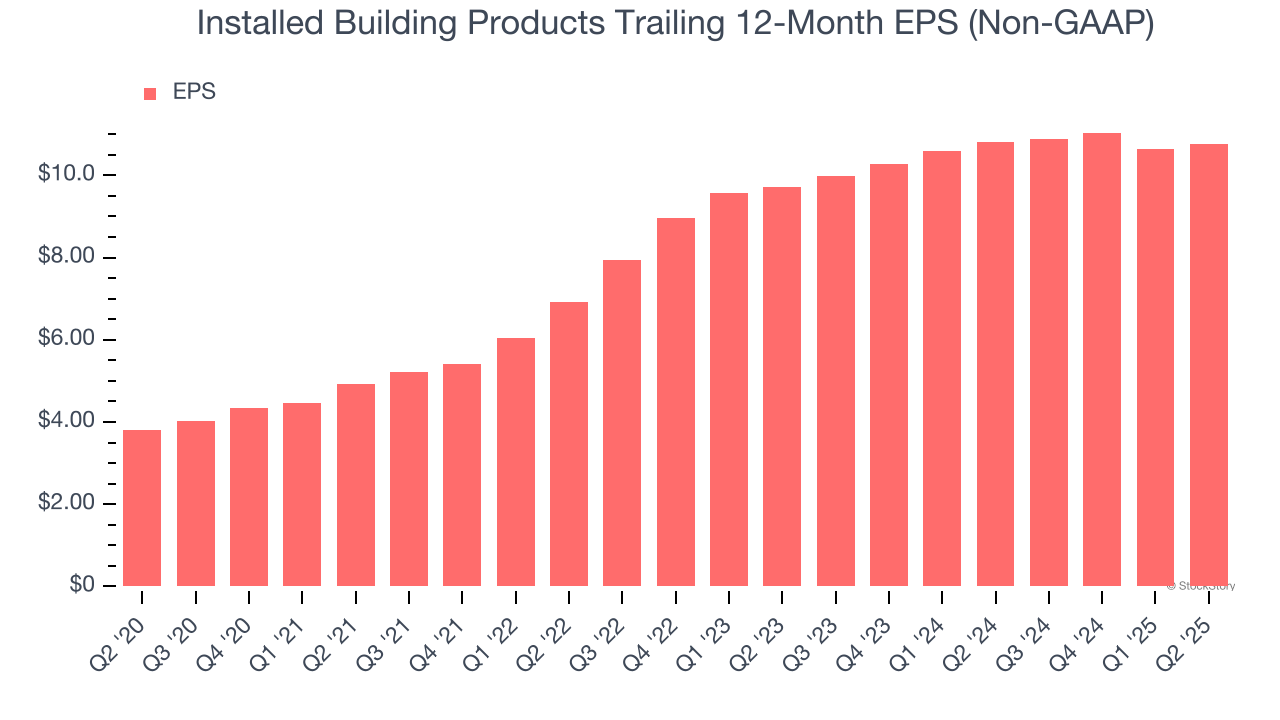
Diving into the nuances of Installed Building Products’s earnings can give us a better understanding of its performance. As we mentioned earlier, Installed Building Products’s operating margin was flat this quarter but expanded by 2.7 percentage points over the last five years. On top of that, its share count shrank by 7.4%. These are positive signs for shareholders because improving profitability and share buybacks turbocharge EPS growth relative to revenue growth. 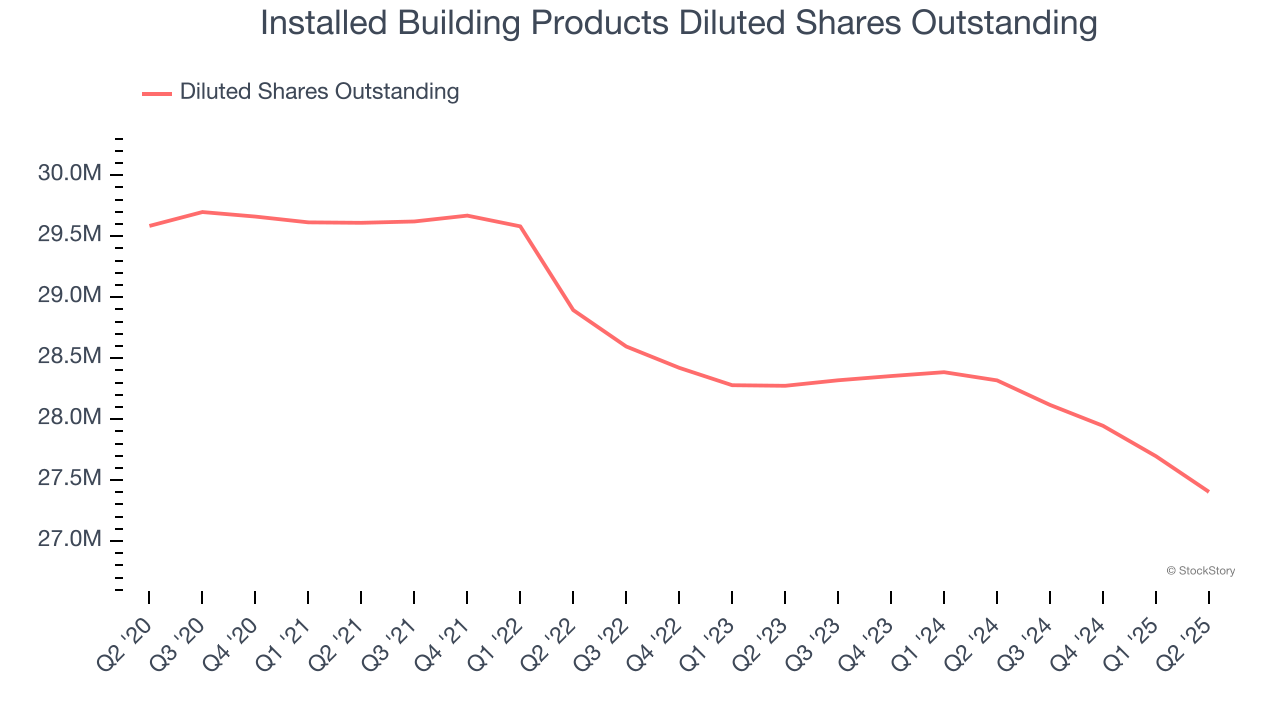
Like with revenue, we analyze EPS over a more recent period because it can provide insight into an emerging theme or development for the business.
For Installed Building Products, its two-year annual EPS growth of 5.3% was lower than its five-year trend. We hope its growth can accelerate in the future.
In Q2, Installed Building Products reported adjusted EPS at $2.95, up from $2.84 in the same quarter last year. This print easily cleared analysts’ estimates, and shareholders should be content with the results. Over the next 12 months, Wall Street expects Installed Building Products’s full-year EPS of $10.76 to shrink by 7.1%.
Key Takeaways from Installed Building Products’s Q2 Results
We were impressed by how significantly Installed Building Products blew past analysts’ organic revenue expectations this quarter. We were also excited its EBITDA outperformed Wall Street’s estimates by a wide margin. Zooming out, we think this was a good print with some key areas of upside. The stock traded up 20.3% to $254.65 immediately after reporting.
Installed Building Products put up rock-solid earnings, but one quarter doesn’t necessarily make the stock a buy. Let’s see if this is a good investment. When making that decision, it’s important to consider its valuation, business qualities, as well as what has happened in the latest quarter. We cover that in our actionable full research report which you can read here, it’s free.