

Real estate franchise company RE/MAX (NYSE:RMAX) missed Wall Street’s revenue expectations in Q2 CY2025, with sales falling 7.3% year on year to $72.75 million. Next quarter’s revenue guidance of $73.5 million underwhelmed, coming in 2.5% below analysts’ estimates. Its non-GAAP profit of $0.39 per share was 11% above analysts’ consensus estimates.
Is now the time to buy RE/MAX? Find out by accessing our full research report, it’s free.
RE/MAX (RMAX) Q2 CY2025 Highlights:
- Revenue: $72.75 million vs analyst estimates of $73.63 million (7.3% year-on-year decline, 1.2% miss)
- Adjusted EPS: $0.39 vs analyst estimates of $0.35 (11% beat)
- Adjusted EBITDA: $26.27 million vs analyst estimates of $24.9 million (36.1% margin, 5.5% beat)
- The company dropped its revenue guidance for the full year to $293 million at the midpoint from $300 million, a 2.3% decrease
- EBITDA guidance for the full year is $92.5 million at the midpoint, below analyst estimates of $94.62 million
- Operating Margin: 19.3%, down from 20.6% in the same quarter last year
- Free Cash Flow Margin: 11.1%, down from 17.8% in the same quarter last year
- Agents: 147,073, up 3,531 year on year
- Market Capitalization: $163.3 million
"Our total agent count was at an all-time high at the end of the second quarter, and we had our best quarter of U.S. agent count performance since the second quarter of 2022, as agents recognize the power of our brand, scale, and continually improving value proposition," said Erik Carlson, RE/MAX Holdings Chief Executive Officer.
Company Overview
Short for Real Estate Maximums, RE/MAX (NYSE:RMAX) operates a real estate franchise network spanning over 100 countries and territories.
Revenue Growth
A company’s long-term performance is an indicator of its overall quality. Any business can experience short-term success, but top-performing ones enjoy sustained growth for years. Over the last five years, RE/MAX grew its sales at a weak 2.6% compounded annual growth rate. This was below our standards and is a tough starting point for our analysis.

We at StockStory place the most emphasis on long-term growth, but within consumer discretionary, a stretched historical view may miss a company riding a successful new product or trend. RE/MAX’s performance shows it grew in the past but relinquished its gains over the last two years, as its revenue fell by 6.1% annually. 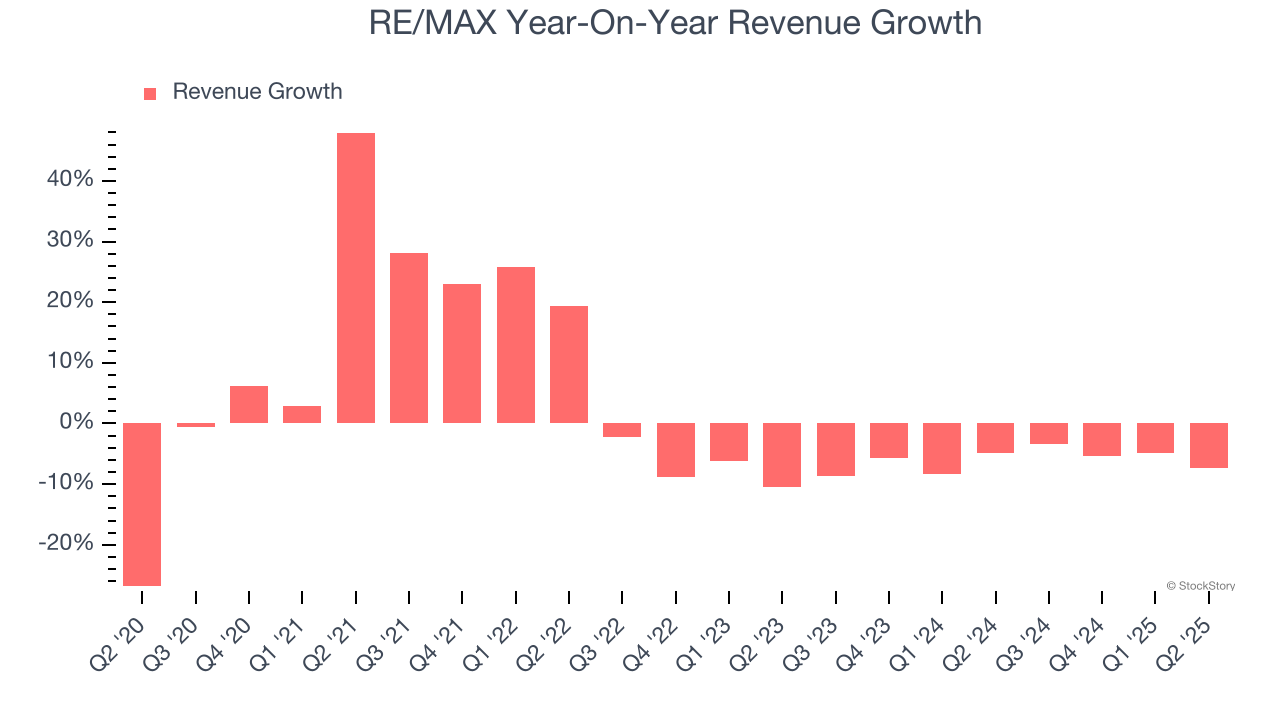
We can better understand the company’s revenue dynamics by analyzing its number of agents, which reached 147,073 in the latest quarter. Over the last two years, RE/MAX’s agents were flat. Because this number is higher than its revenue growth during the same period, we can see the company’s monetization has fallen. 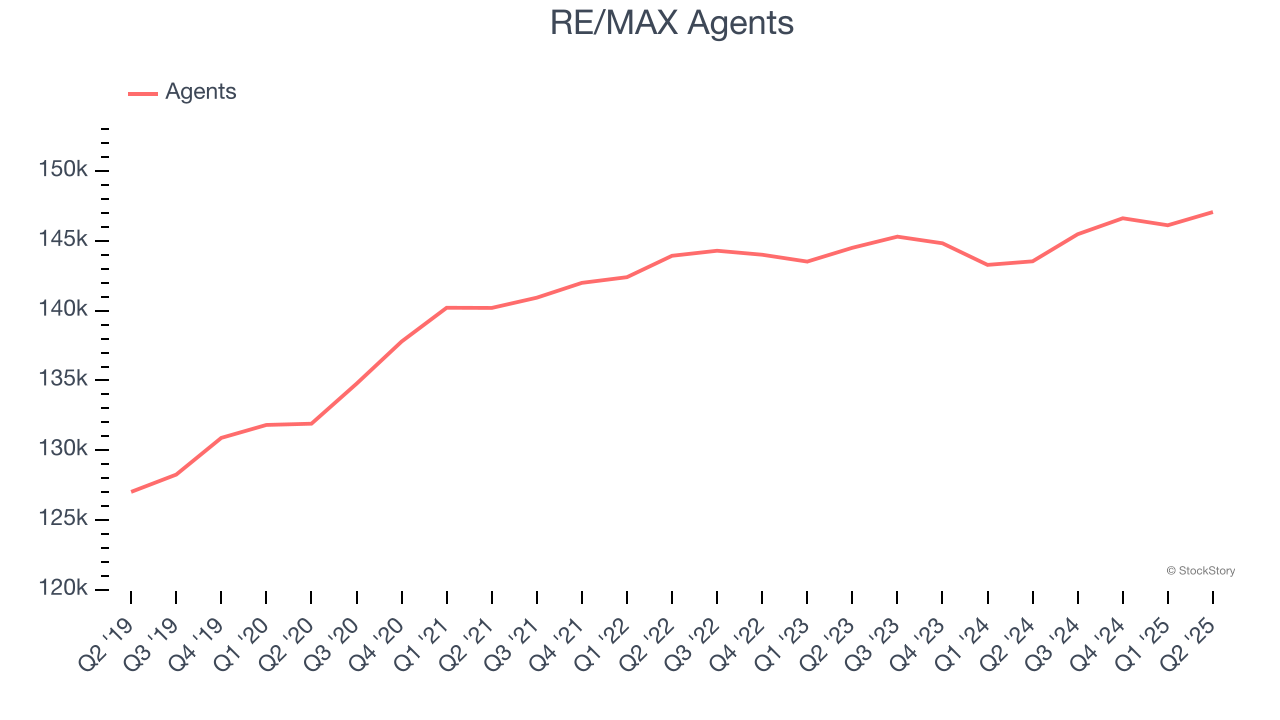
This quarter, RE/MAX missed Wall Street’s estimates and reported a rather uninspiring 7.3% year-on-year revenue decline, generating $72.75 million of revenue. Company management is currently guiding for a 6.3% year-on-year decline in sales next quarter.
Looking further ahead, sell-side analysts expect revenue to decline by 1.1% over the next 12 months. While this projection is better than its two-year trend, it’s tough to feel optimistic about a company facing demand difficulties.
Software is eating the world and there is virtually no industry left that has been untouched by it. That drives increasing demand for tools helping software developers do their jobs, whether it be monitoring critical cloud infrastructure, integrating audio and video functionality, or ensuring smooth content streaming. Click here to access a free report on our 3 favorite stocks to play this generational megatrend.
Operating Margin
RE/MAX’s operating margin has been trending up over the last 12 months and averaged 4.7% over the last two years. The company’s higher efficiency is a breath of fresh air, but its suboptimal cost structure means it still sports lousy profitability for a consumer discretionary business.
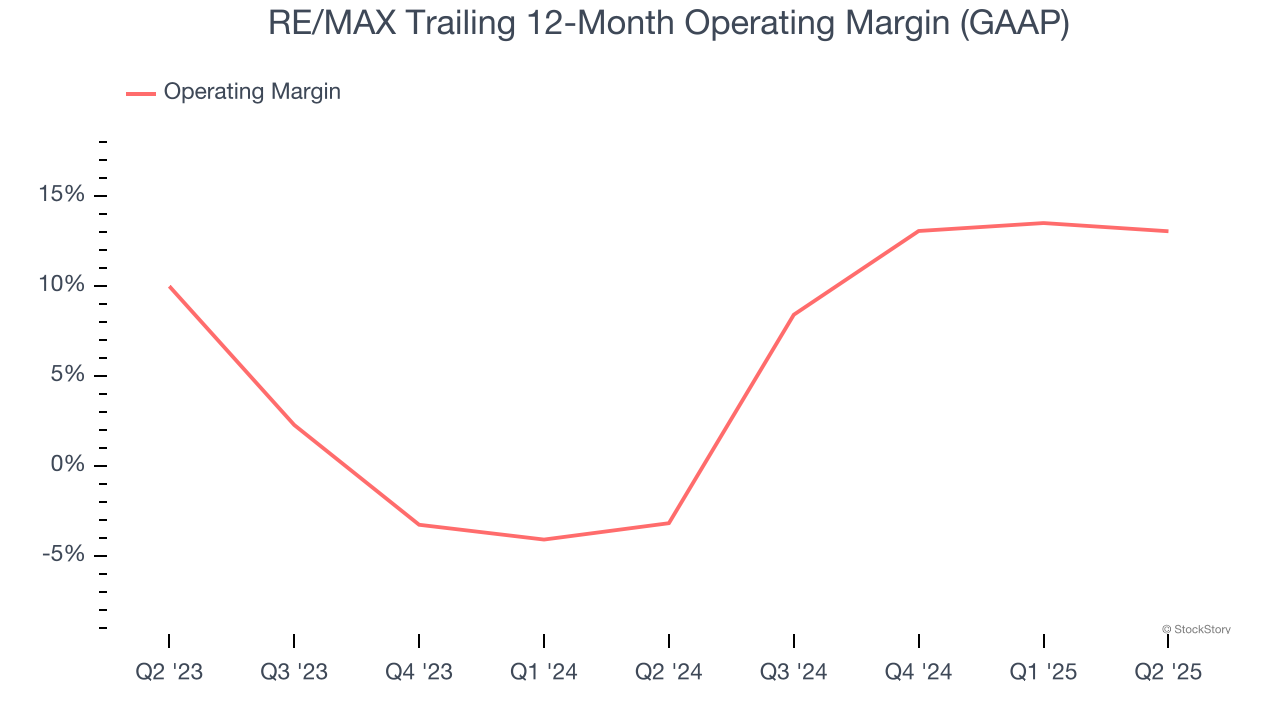
In Q2, RE/MAX generated an operating margin profit margin of 19.3%, down 1.3 percentage points year on year. This reduction is quite minuscule and indicates the company’s overall cost structure has been relatively stable.
Earnings Per Share
We track the long-term change in earnings per share (EPS) for the same reason as long-term revenue growth. Compared to revenue, however, EPS highlights whether a company’s growth is profitable.
Sadly for RE/MAX, its EPS declined by 6.7% annually over the last five years while its revenue grew by 2.6%. However, its operating margin actually improved during this time, telling us that non-fundamental factors such as interest expenses and taxes affected its ultimate earnings.
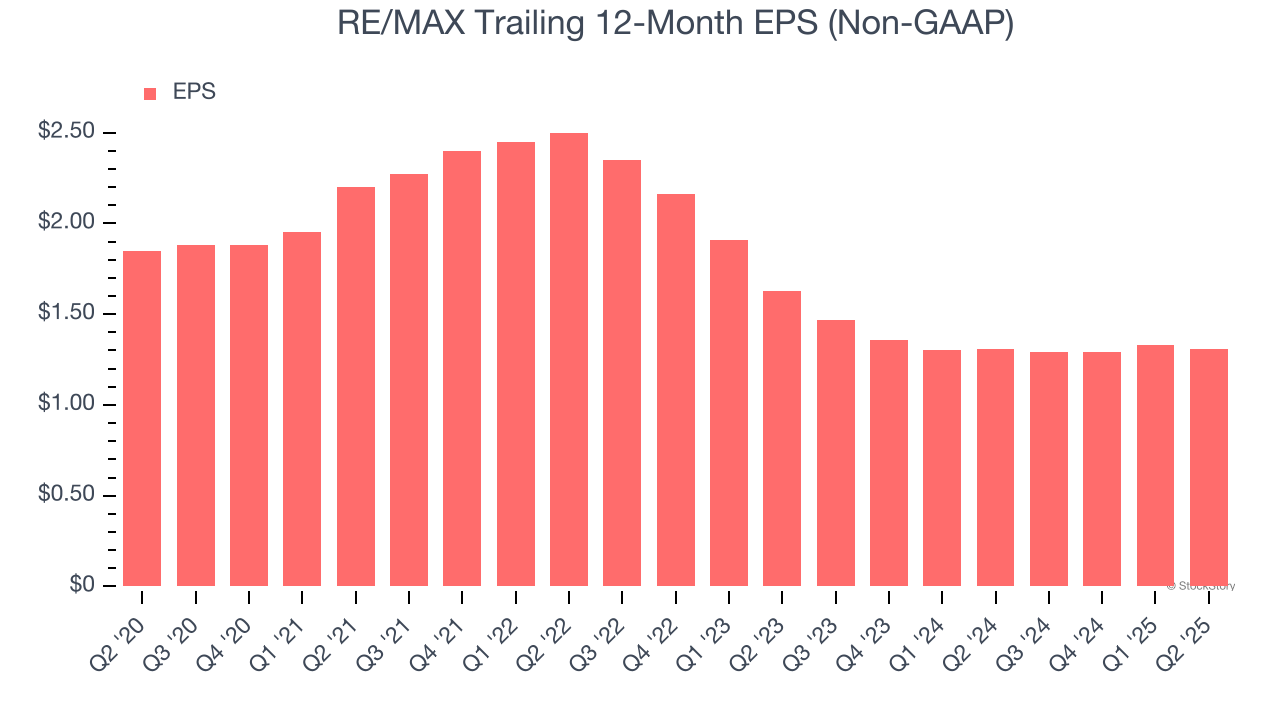
In Q2, RE/MAX reported EPS at $0.39, down from $0.41 in the same quarter last year. Despite falling year on year, this print easily cleared analysts’ estimates. Over the next 12 months, Wall Street expects RE/MAX’s full-year EPS of $1.31 to grow 1.3%.
Key Takeaways from RE/MAX’s Q2 Results
It was encouraging to see RE/MAX beat analysts’ EPS expectations this quarter. We were also happy its EBITDA outperformed Wall Street’s estimates. On the other hand, its EBITDA guidance for next quarter missed and its revenue fell slightly short of Wall Street’s estimates. Overall, this was a weaker quarter. The stock remained flat at $8.52 immediately following the results.
RE/MAX’s earnings report left more to be desired. Let’s look forward to see if this quarter has created an opportunity to buy the stock. The latest quarter does matter, but not nearly as much as longer-term fundamentals and valuation, when deciding if the stock is a buy. We cover that in our actionable full research report which you can read here, it’s free.