

Gas handling company Chart (NYSE:GTLS) missed Wall Street’s revenue expectations in Q2 CY2025 as sales rose 4% year on year to $1.08 billion. Its non-GAAP profit of $2.59 per share was 3.3% above analysts’ consensus estimates.
Is now the time to buy Chart? Find out by accessing our full research report, it’s free.
Chart (GTLS) Q2 CY2025 Highlights:
- Baker Hughes (NASDAQ: BKR) and Chart Industries (NYSE: GTLS) (“Chart”) announced Tuesday they have entered into a definitive agreement under which Baker Hughes will acquire all outstanding shares of Chart’s common stock for $210 per share in cash, equivalent to a total enterprise value of $13.6 billion.
- Revenue: $1.08 billion vs analyst estimates of $1.11 billion (4% year-on-year growth, 2.3% miss)
- Adjusted EPS: $2.59 vs analyst estimates of $2.51 (3.3% beat)
- Adjusted EBITDA: $245.1 million vs analyst estimates of $268.4 million (22.6% margin, 8.7% miss)
- Operating Margin: 15.7%, in line with the same quarter last year
- Free Cash Flow Margin: 11.3%, up from 8.5% in the same quarter last year
- Backlog: $5.54 billion at quarter end, up 25.1% year on year
- Market Capitalization: $7.71 billion
“We booked $1.50 billion of orders in the second quarter 2025 demonstrating continued strength in our end markets, more systems and solutions sales, and an increasing aftermarket, service and repair attachment with customers increasingly utilizing our process technologies,” stated Jill Evanko, Chart Industries’ CEO and President.
Company Overview
Installing the first bulk Co2 tank for McDonalds’s sodas, Chart (NYSE:GTLS) provides equipment to store and transport gasses.
Revenue Growth
Reviewing a company’s long-term sales performance reveals insights into its quality. Even a bad business can shine for one or two quarters, but a top-tier one grows for years. Thankfully, Chart’s 27.7% annualized revenue growth over the last five years was incredible. Its growth surpassed the average industrials company and shows its offerings resonate with customers, a great starting point for our analysis.
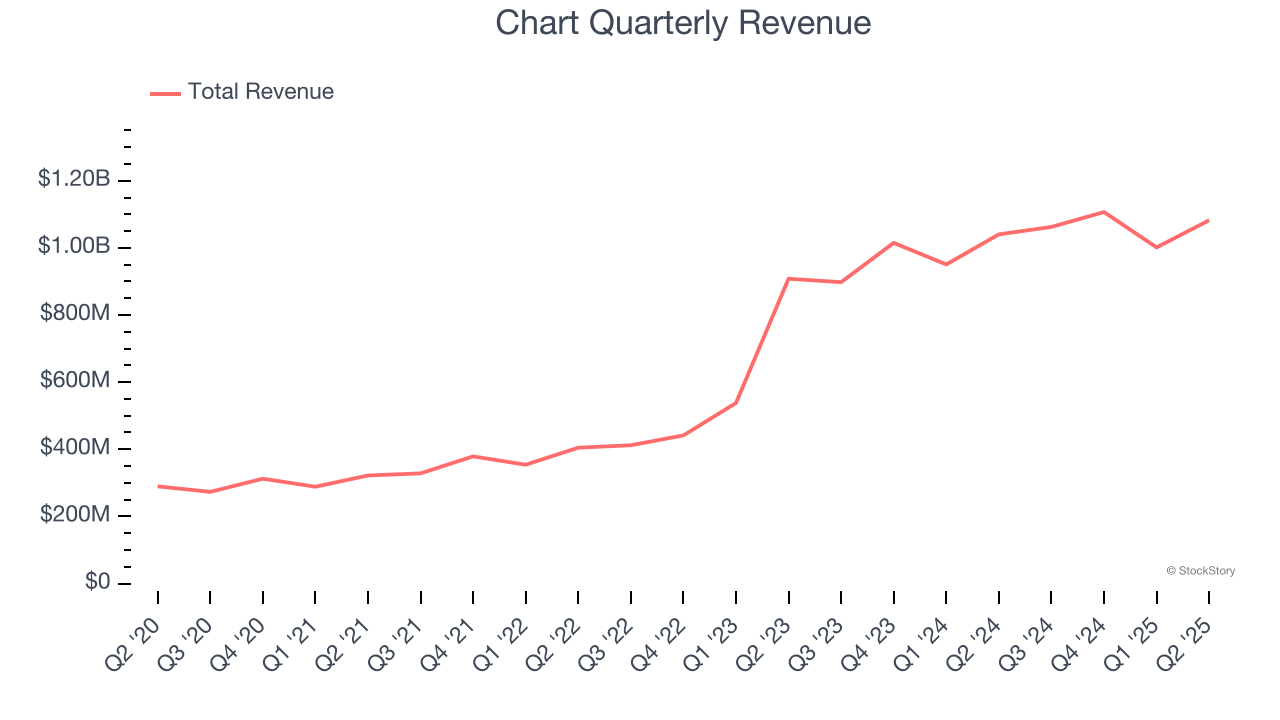
Long-term growth is the most important, but within industrials, a half-decade historical view may miss new industry trends or demand cycles. Chart’s annualized revenue growth of 36% over the last two years is above its five-year trend, suggesting its demand was strong and recently accelerated. 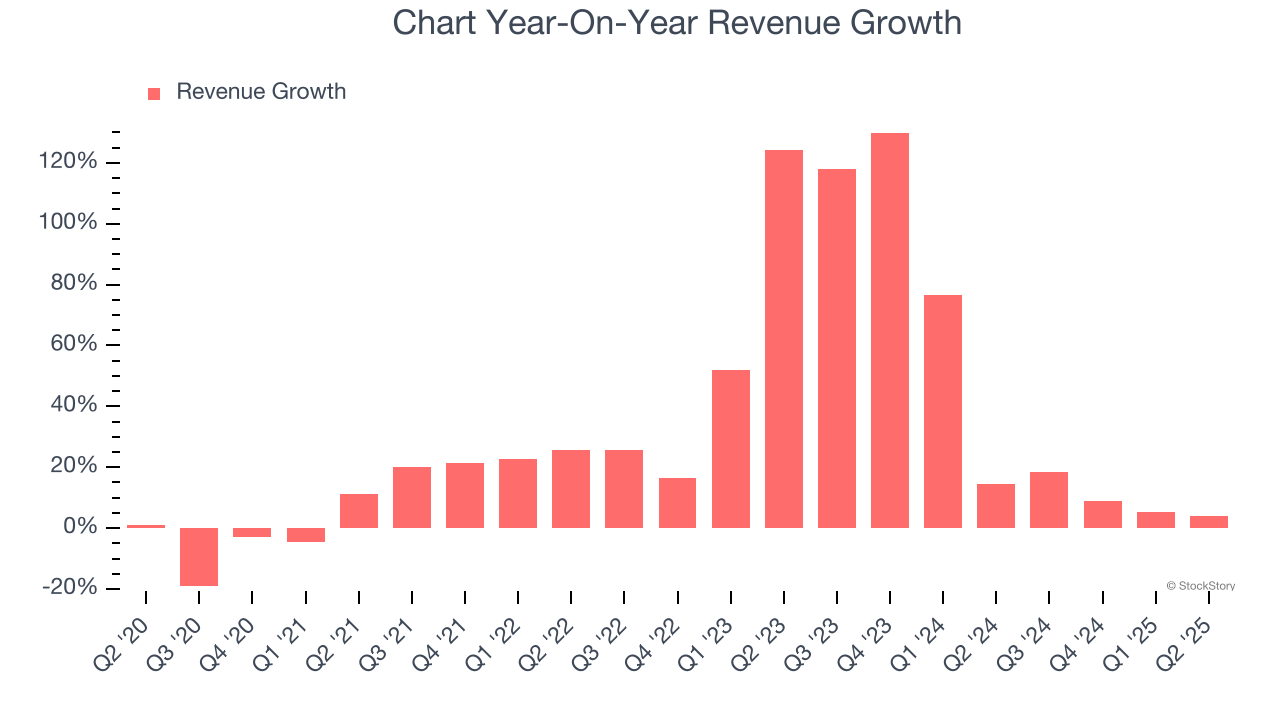
We can dig further into the company’s revenue dynamics by analyzing its backlog, or the value of its outstanding orders that have not yet been executed or delivered. Chart’s backlog reached $5.54 billion in the latest quarter and averaged 31.9% year-on-year growth over the last two years. Because this number is lower than its revenue growth, we can see the company fulfilled orders at a faster rate than it added new orders to the backlog. This implies Chart was operating efficiently but raises questions about the health of its sales pipeline. 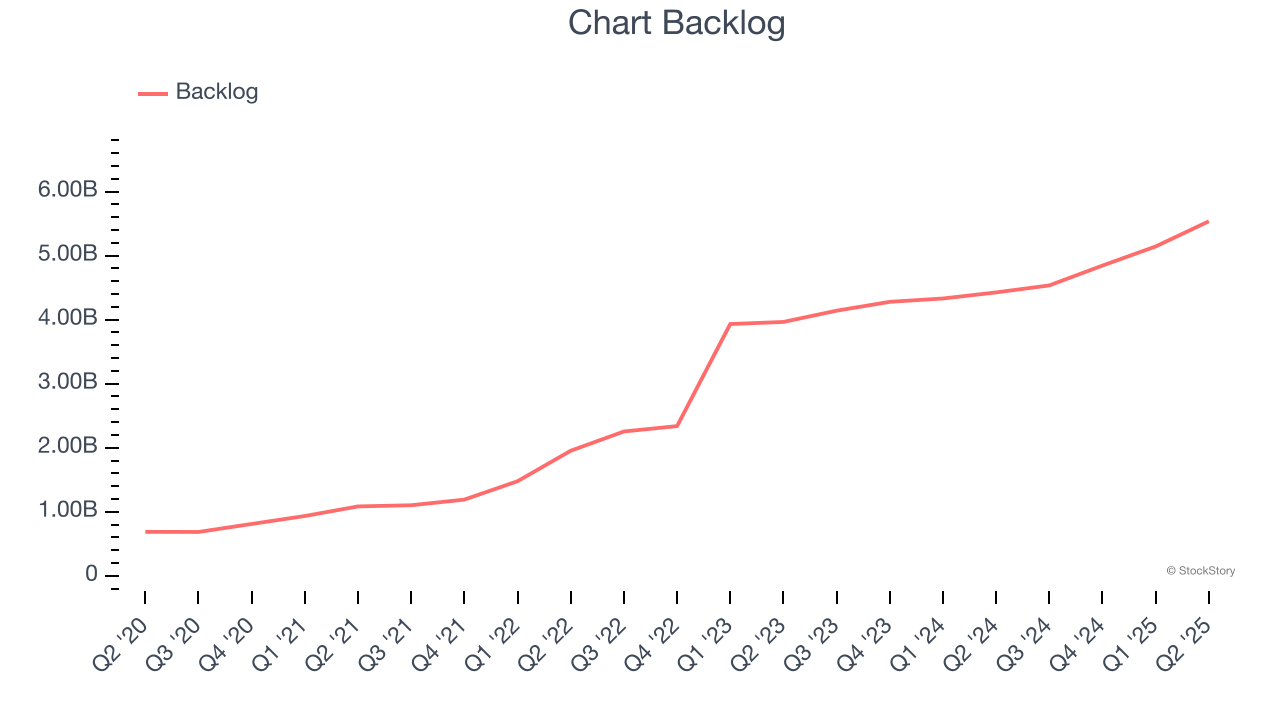
This quarter, Chart’s revenue grew by 4% year on year to $1.08 billion, falling short of Wall Street’s estimates.
Looking ahead, sell-side analysts expect revenue to grow 13.8% over the next 12 months, a deceleration versus the last two years. Still, this projection is healthy and indicates the market is baking in success for its products and services.
Software is eating the world and there is virtually no industry left that has been untouched by it. That drives increasing demand for tools helping software developers do their jobs, whether it be monitoring critical cloud infrastructure, integrating audio and video functionality, or ensuring smooth content streaming. Click here to access a free report on our 3 favorite stocks to play this generational megatrend.
Operating Margin
Operating margin is a key measure of profitability. Think of it as net income - the bottom line - excluding the impact of taxes and interest on debt, which are less connected to business fundamentals.
Chart has been an efficient company over the last five years. It was one of the more profitable businesses in the industrials sector, boasting an average operating margin of 12.6%.
Analyzing the trend in its profitability, Chart’s operating margin rose by 7.4 percentage points over the last five years, as its sales growth gave it immense operating leverage.
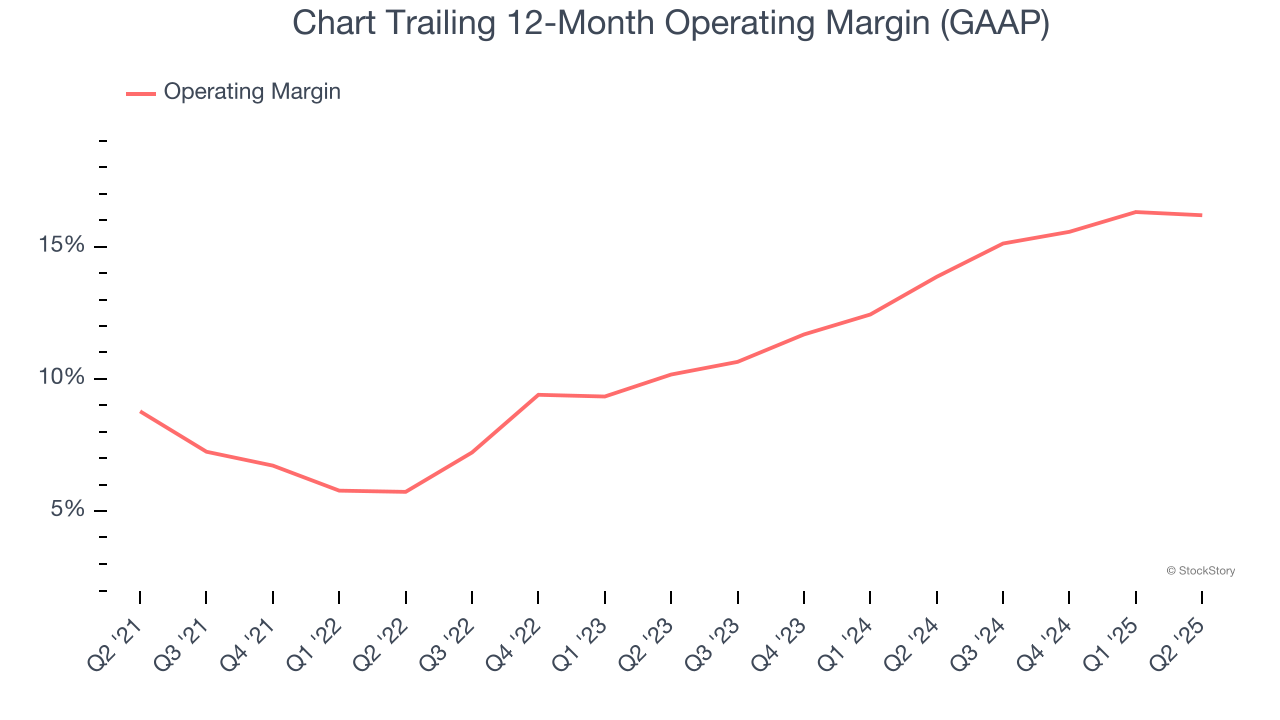
In Q2, Chart generated an operating margin profit margin of 15.7%, in line with the same quarter last year. This indicates the company’s cost structure has recently been stable.
Earnings Per Share
Revenue trends explain a company’s historical growth, but the long-term change in earnings per share (EPS) points to the profitability of that growth – for example, a company could inflate its sales through excessive spending on advertising and promotions.
Chart’s astounding 28.1% annual EPS growth over the last five years aligns with its revenue performance. This tells us its incremental sales were profitable.
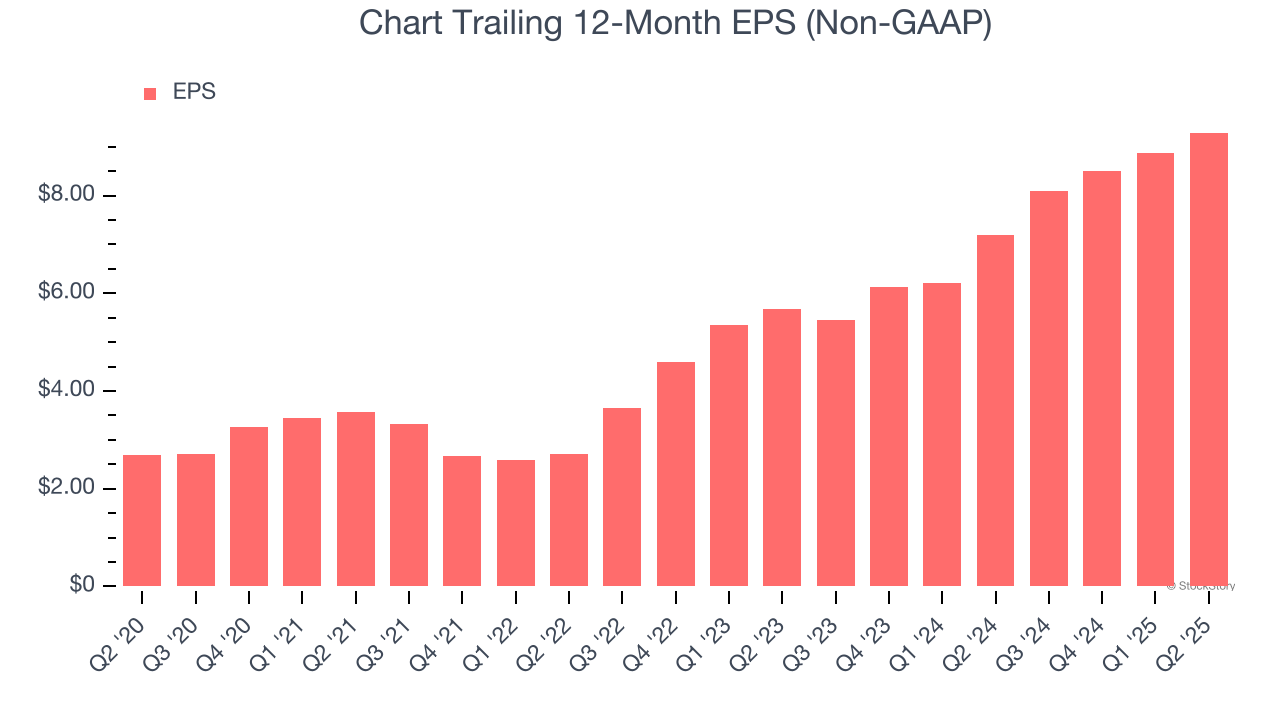
Like with revenue, we analyze EPS over a shorter period to see if we are missing a change in the business.
For Chart, its two-year annual EPS growth of 28% is similar to its five-year trend, implying strong and stable earnings power.
In Q2, Chart reported EPS at $2.59, up from $2.18 in the same quarter last year. This print beat analysts’ estimates by 3.3%. Over the next 12 months, Wall Street expects Chart’s full-year EPS of $9.29 to grow 46.6%.
Key Takeaways from Chart’s Q2 Results
Baker Hughes (NASDAQ: BKR) and Chart Industries (NYSE: GTLS) (“Chart”) announced Tuesday they have entered into a definitive agreement under which Baker Hughes will acquire all outstanding shares of Chart’s common stock for $210 per share in cash, equivalent to a total enterprise value of $13.6 billion.
As for the quarter, we were impressed by how significantly Chart blew past analysts’ backlog expectations this quarter. We were also happy its EPS outperformed Wall Street’s estimates. On the other hand, its revenue missed and its EBITDA fell short of Wall Street’s estimates. Overall, this was a softer quarter. The stock traded up 16.5% to $200.03 immediately after reporting.
Is Chart an attractive investment opportunity right now? We think that the latest quarter is only one piece of the longer-term business quality puzzle. Quality, when combined with valuation, can help determine if the stock is a buy. We cover that in our actionable full research report which you can read here, it’s free.