

Maintenance and repair supplier W.W. Grainger (NYSE:GWW) met Wall Streets revenue expectations in Q3 CY2025, with sales up 6.1% year on year to $4.66 billion. On the other hand, the company’s full-year revenue guidance of $17.9 billion at the midpoint came in 0.7% below analysts’ estimates. Its non-GAAP profit of $10.21 per share was 2.6% above analysts’ consensus estimates.
Is now the time to buy W.W. Grainger? Find out by accessing our full research report, it’s free for active Edge members.
W.W. Grainger (GWW) Q3 CY2025 Highlights:
- Revenue: $4.66 billion vs analyst estimates of $4.64 billion (6.1% year-on-year growth, in line)
- Adjusted EPS: $10.21 vs analyst estimates of $9.95 (2.6% beat)
- Adjusted EBITDA: $590 million vs analyst estimates of $739.3 million (12.7% margin, 20.2% miss)
- The company slightly lifted its revenue guidance for the full year to $17.9 billion at the midpoint from $17.85 billion
- Adjusted EPS guidance for the full year is $39.38 at the midpoint, roughly in line with what analysts were expecting
- Operating Margin: 11%, down from 15.6% in the same quarter last year
- Free Cash Flow Margin: 7.3%, down from 11.9% in the same quarter last year
- Organic Revenue rose 5.4% year on year vs analyst estimates of 5.7% growth (30.7 basis point miss)
- Market Capitalization: $45.74 billion
"We delivered results in-line with our expectations for the quarter, reinforcing the value and differentiated experience Grainger consistently creates for our customers," said D.G. Macpherson, Chairman and CEO.
Company Overview
Founded as a supplier of motors, W.W. Grainger (NYSE:GWW) provides maintenance, repair, and operating (MRO) supplies and services to businesses and institutions.
Revenue Growth
A company’s long-term performance is an indicator of its overall quality. Any business can have short-term success, but a top-tier one grows for years. Over the last five years, W.W. Grainger grew its sales at a decent 8.7% compounded annual growth rate. Its growth was slightly above the average industrials company and shows its offerings resonate with customers.
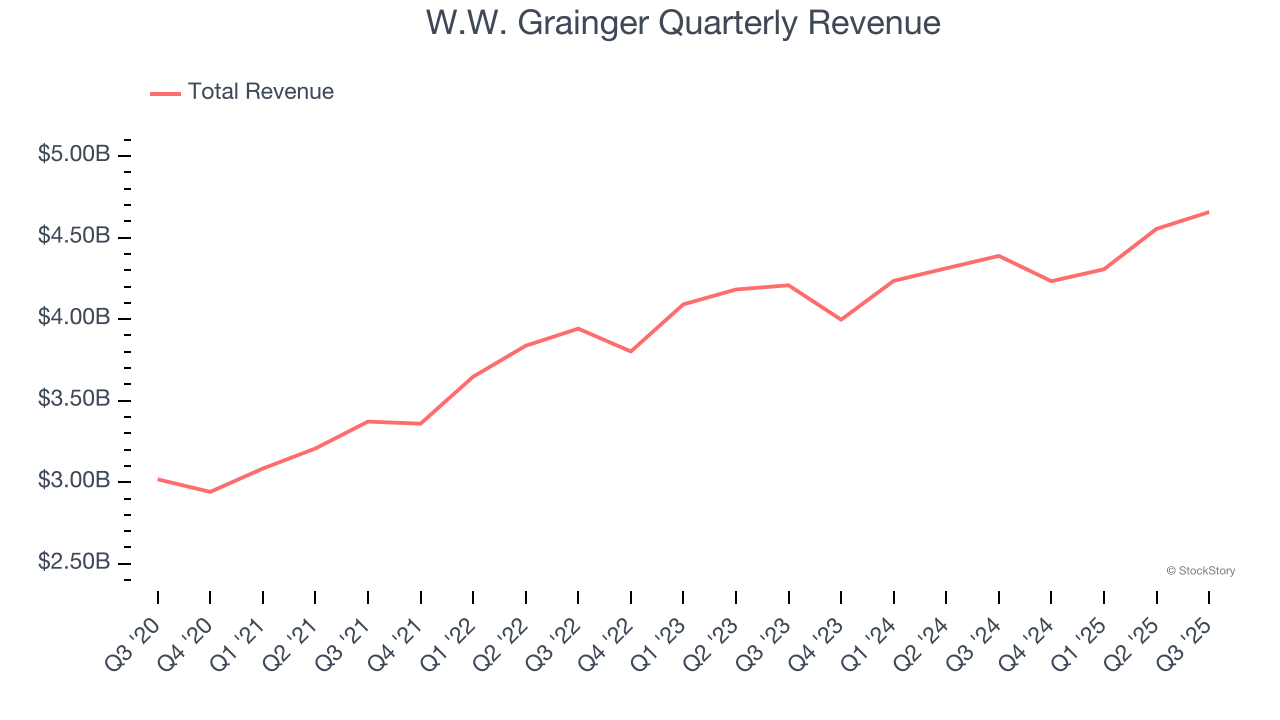
We at StockStory place the most emphasis on long-term growth, but within industrials, a half-decade historical view may miss cycles, industry trends, or a company capitalizing on catalysts such as a new contract win or a successful product line. W.W. Grainger’s recent performance shows its demand has slowed as its annualized revenue growth of 4.4% over the last two years was below its five-year trend. 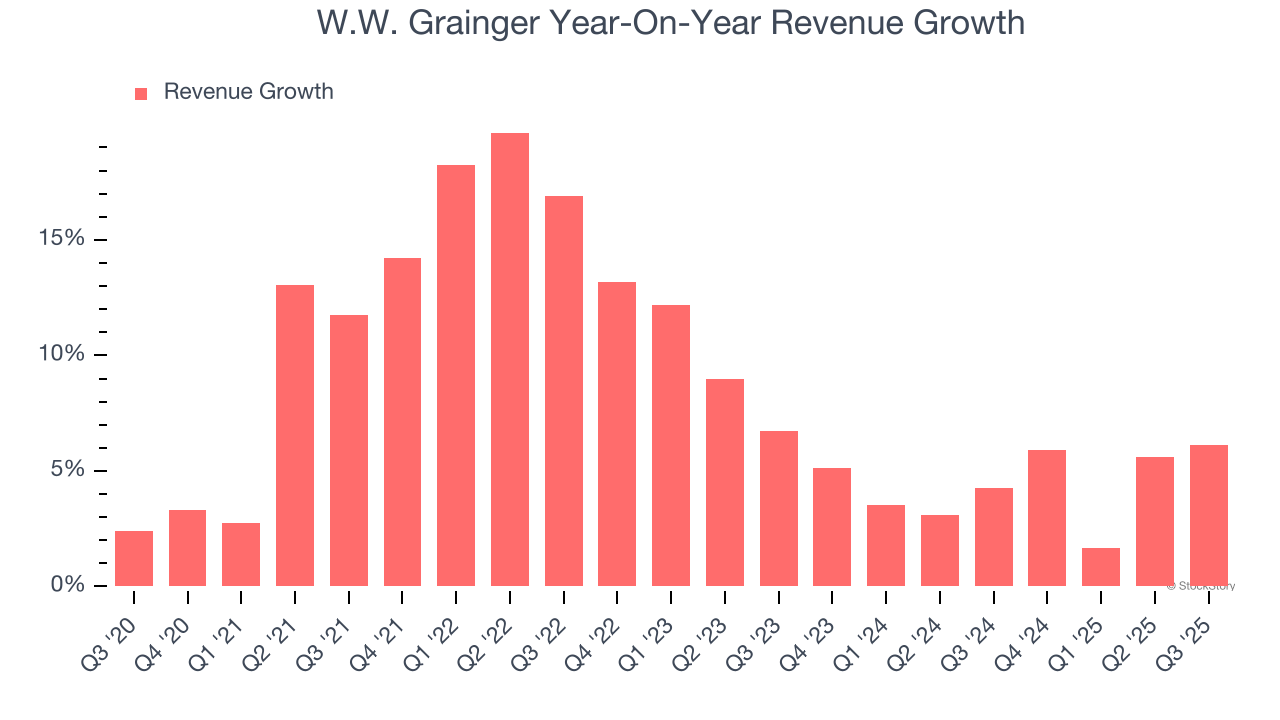
We can dig further into the company’s sales dynamics by analyzing its organic revenue, which strips out one-time events like acquisitions and currency fluctuations that don’t accurately reflect its fundamentals. Over the last two years, W.W. Grainger’s organic revenue averaged 4.9% year-on-year growth. Because this number aligns with its two-year revenue growth, we can see the company’s core operations (not acquisitions and divestitures) drove most of its results. 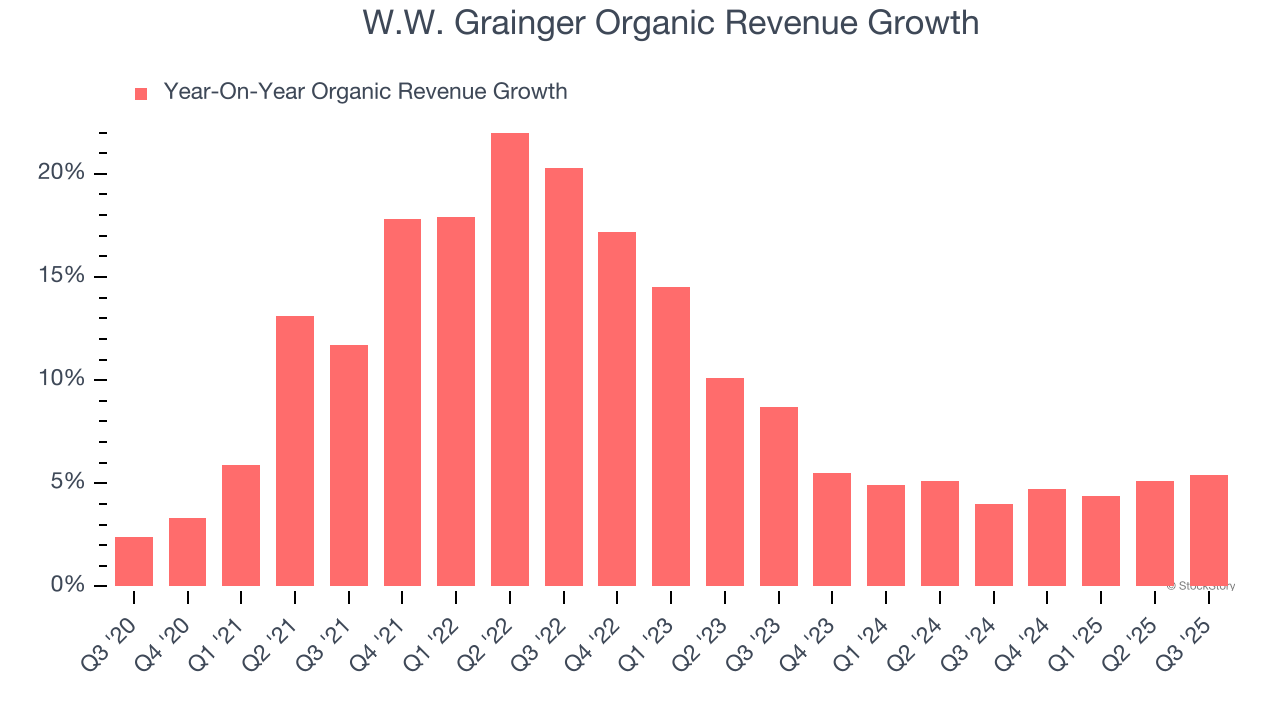
This quarter, W.W. Grainger grew its revenue by 6.1% year on year, and its $4.66 billion of revenue was in line with Wall Street’s estimates.
Looking ahead, sell-side analysts expect revenue to grow 6.3% over the next 12 months. While this projection indicates its newer products and services will fuel better top-line performance, it is still below average for the sector.
Unless you’ve been living under a rock, it should be obvious by now that generative AI is going to have a huge impact on how large corporations do business. While Nvidia and AMD are trading close to all-time highs, we prefer a lesser-known (but still profitable) stock benefiting from the rise of AI. Click here to access our free report one of our favorites growth stories.
Operating Margin
W.W. Grainger has been an efficient company over the last five years. It was one of the more profitable businesses in the industrials sector, boasting an average operating margin of 14.2%. This result isn’t surprising as its high gross margin gives it a favorable starting point.
Looking at the trend in its profitability, W.W. Grainger’s operating margin rose by 2.9 percentage points over the last five years, as its sales growth gave it operating leverage.
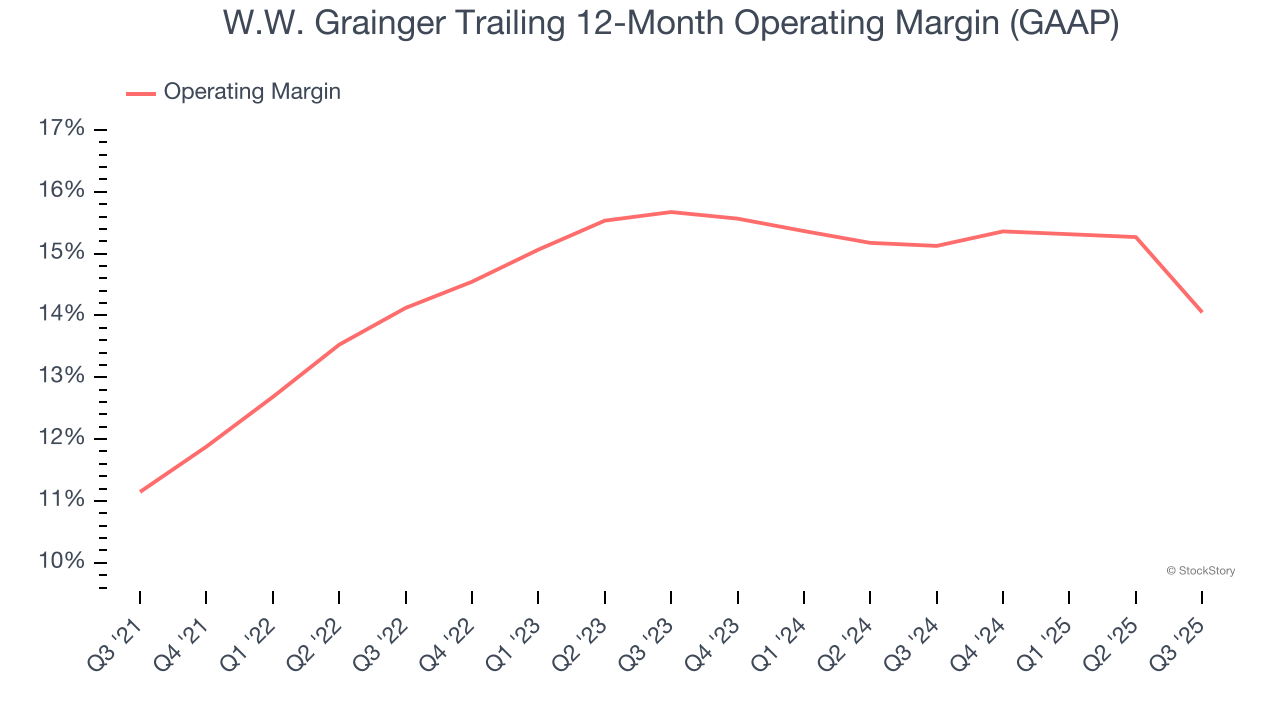
In Q3, W.W. Grainger generated an operating margin profit margin of 11%, down 4.7 percentage points year on year. Since W.W. Grainger’s operating margin decreased more than its gross margin, we can assume it was less efficient because expenses such as marketing, R&D, and administrative overhead increased.
Earnings Per Share
Revenue trends explain a company’s historical growth, but the long-term change in earnings per share (EPS) points to the profitability of that growth – for example, a company could inflate its sales through excessive spending on advertising and promotions.
W.W. Grainger’s EPS grew at an astounding 19.4% compounded annual growth rate over the last five years, higher than its 8.7% annualized revenue growth. This tells us the company became more profitable on a per-share basis as it expanded.
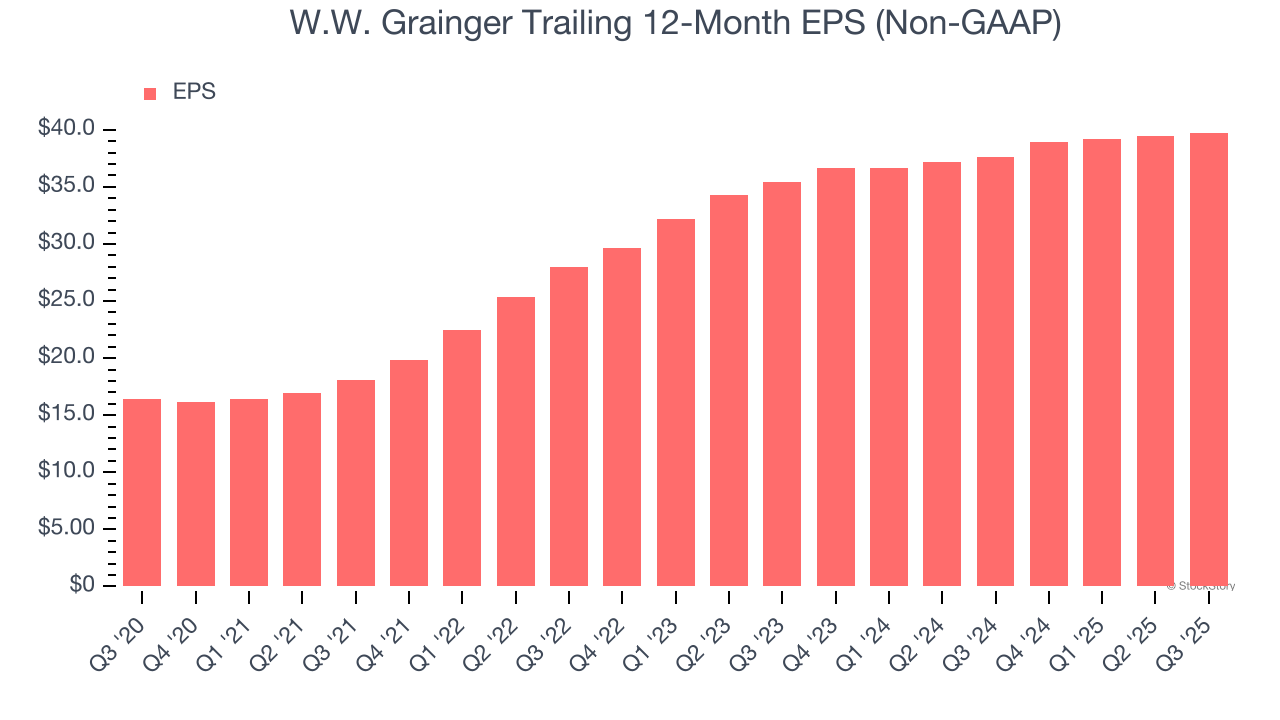
Diving into W.W. Grainger’s quality of earnings can give us a better understanding of its performance. As we mentioned earlier, W.W. Grainger’s operating margin declined this quarter but expanded by 2.9 percentage points over the last five years. Its share count also shrank by 11.1%, and these factors together are positive signs for shareholders because improving profitability and share buybacks turbocharge EPS growth relative to revenue growth. 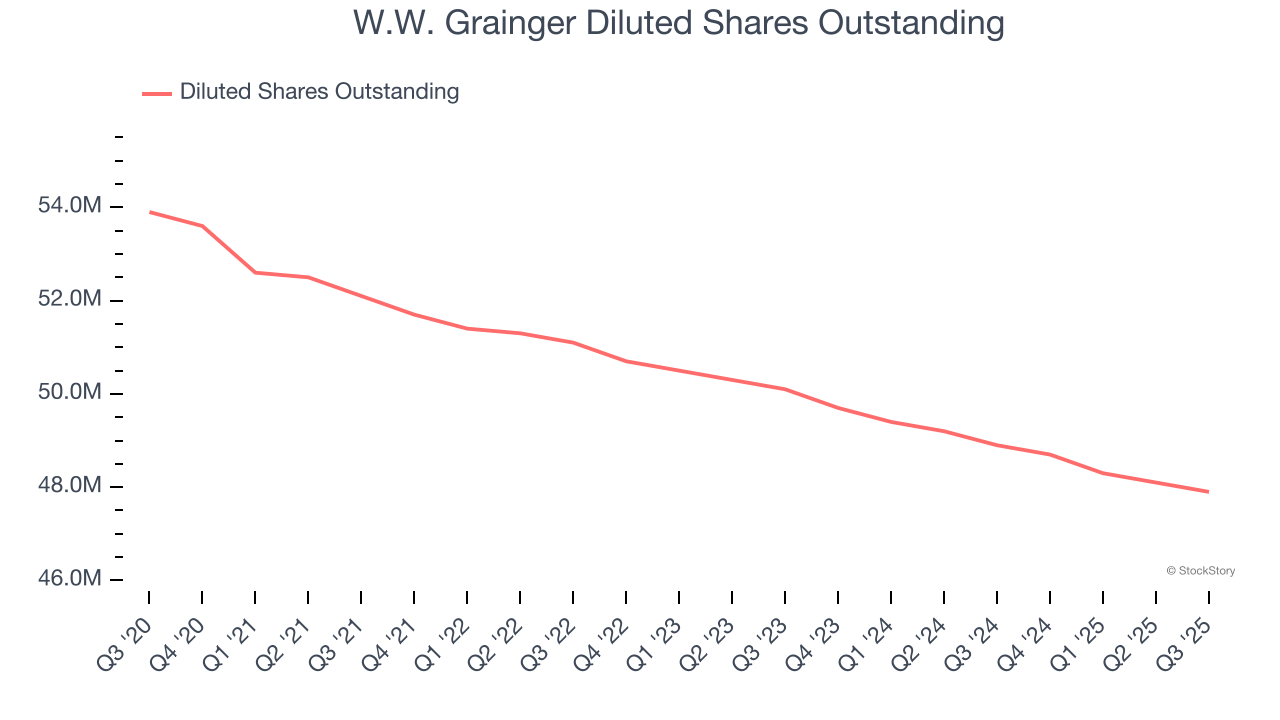
Like with revenue, we analyze EPS over a shorter period to see if we are missing a change in the business.
For W.W. Grainger, its two-year annual EPS growth of 5.9% was lower than its five-year trend. We hope its growth can accelerate in the future.
In Q3, W.W. Grainger reported adjusted EPS of $10.21, up from $9.87 in the same quarter last year. This print beat analysts’ estimates by 2.6%. Over the next 12 months, Wall Street expects W.W. Grainger’s full-year EPS of $39.75 to grow 7.7%.
Key Takeaways from W.W. Grainger’s Q3 Results
It was good to see W.W. Grainger meet analysts’ revenue expectations this quarter. We were also glad its EPS outperformed Wall Street’s estimates. On the other hand, its EBITDA missed and its full-year revenue guidance fell slightly short of Wall Street’s estimates. Overall, this was a softer quarter. The stock remained flat at $958.15 immediately after reporting.
So do we think W.W. Grainger is an attractive buy at the current price? If you’re making that decision, you should consider the bigger picture of valuation, business qualities, as well as the latest earnings. We cover that in our actionable full research report which you can read here, it’s free for active Edge members.