
Investment management firm T. Rowe Price (NASDAQ:TROW) reported Q3 CY2025 results beating Wall Street’s revenue expectations, with sales up 6% year on year to $1.89 billion. Its non-GAAP profit of $2.81 per share was 10.5% above analysts’ consensus estimates.
Is now the time to buy T. Rowe Price? Find out by accessing our full research report, it’s free for active Edge members.
T. Rowe Price (TROW) Q3 CY2025 Highlights:
- Assets Under Management: $1.77 trillion vs analyst estimates of $1.74 trillion (8.5% year-on-year growth, 1.6% beat)
- Advisory and Services Fees: $1.70 billion vs analyst estimates of $1.71 billion (4.4% year-on-year growth, 0.6% miss)
- Revenue: $1.89 billion vs analyst estimates of $1.87 billion (6% year-on-year growth, 1.4% beat)
- Pre-tax Profit: $881.6 million (46.6% margin, 6.7% year-on-year growth)
- Adjusted EPS: $2.81 vs analyst estimates of $2.54 (10.5% beat)
- Market Capitalization: $22.44 billion
Company Overview
Founded in 1937 by Thomas Rowe Price Jr., who pioneered the growth stock investing approach, T. Rowe Price (NASDAQ:TROW) is an investment management firm that offers mutual funds, advisory services, and retirement planning solutions to individuals and institutions.
Revenue Growth
Examining a company’s long-term performance can provide clues about its quality. Any business can put up a good quarter or two, but many enduring ones grow for years. Over the last five years, T. Rowe Price grew its revenue at a sluggish 3.9% compounded annual growth rate. This was below our standard for the financials sector and is a rough starting point for our analysis.
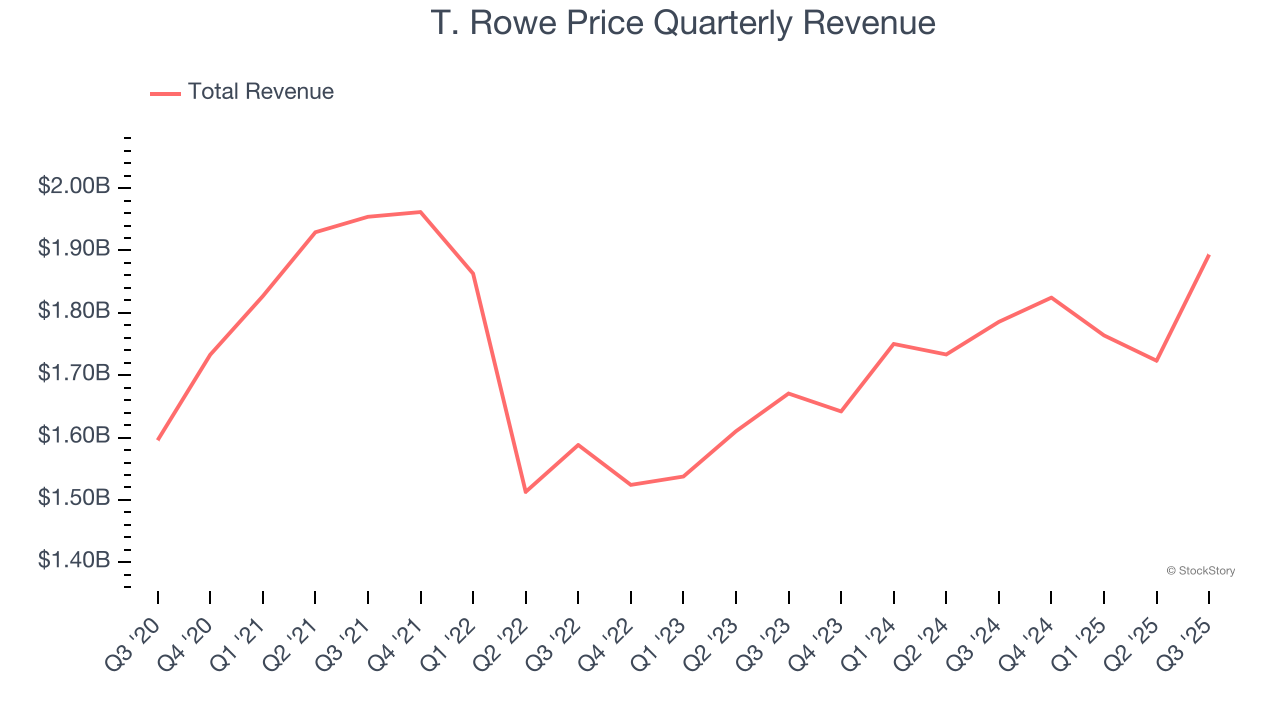
We at StockStory place the most emphasis on long-term growth, but within financials, a half-decade historical view may miss recent interest rate changes, market returns, and industry trends. T. Rowe Price’s annualized revenue growth of 6.6% over the last two years is above its five-year trend, but we were still disappointed by the results. 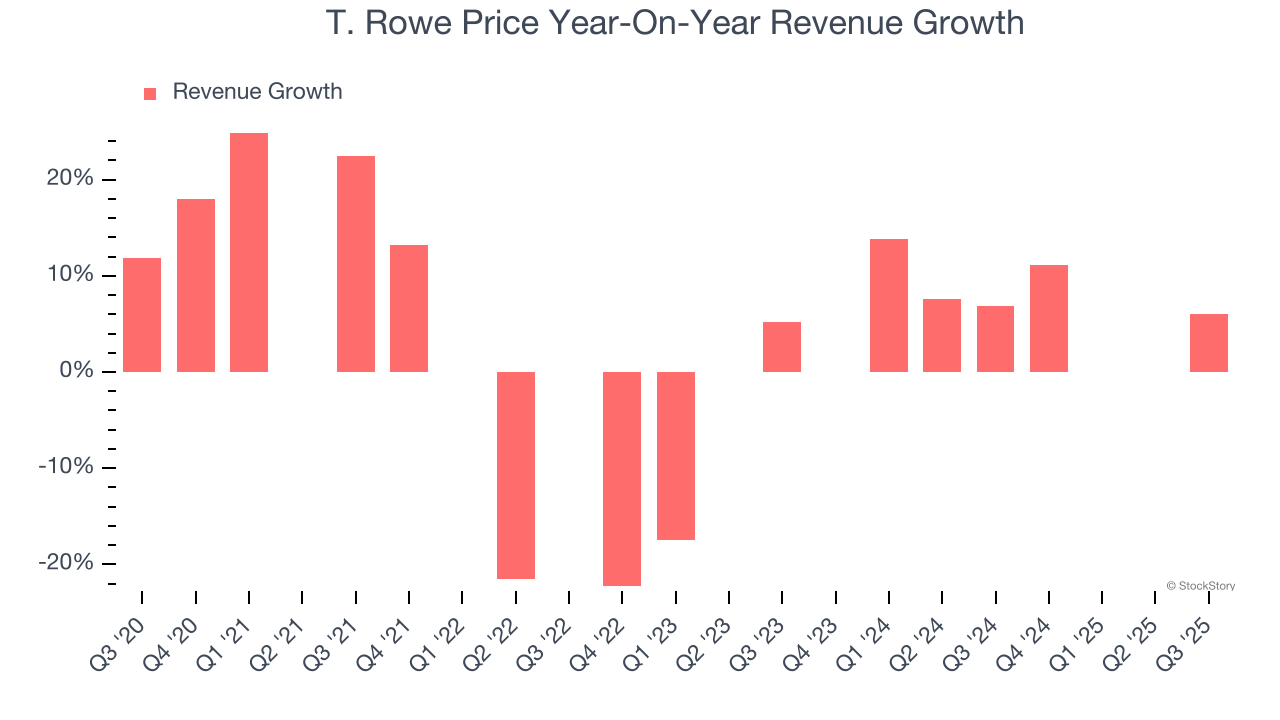 Note: Quarters not shown were determined to be outliers, impacted by outsized investment gains/losses that are not indicative of the recurring fundamentals of the business.
This quarter, T. Rowe Price reported year-on-year revenue growth of 6%, and its $1.89 billion of revenue exceeded Wall Street’s estimates by 1.4%.
Software is eating the world and there is virtually no industry left that has been untouched by it. That drives increasing demand for tools helping software developers do their jobs, whether it be monitoring critical cloud infrastructure, integrating audio and video functionality, or ensuring smooth content streaming. Click here to access a free report on our 3 favorite stocks to play this generational megatrend.
Assets Under Management (AUM)
Assets Under Management (AUM) encompasses all client funds under a firm's investment management umbrella. The recurring fee structure on these assets provides consistent revenue generation, offering financial stability even during periods of poor investment returns, though sustained underperformance can impact future asset flows.
T. Rowe Price’s AUM has grown at an annual rate of 1.6% over the last four years, much worse than the broader financials industry. When analyzing T. Rowe Price’s AUM over the last two years, we can see that growth accelerated to 11.1% annually. Fundraising or short-term investment performance were net contributors for the company over this shorter period since assets grew faster than total revenue. That said, assets aren't the be-all and end-all due to their unpredictable and cyclical nature.
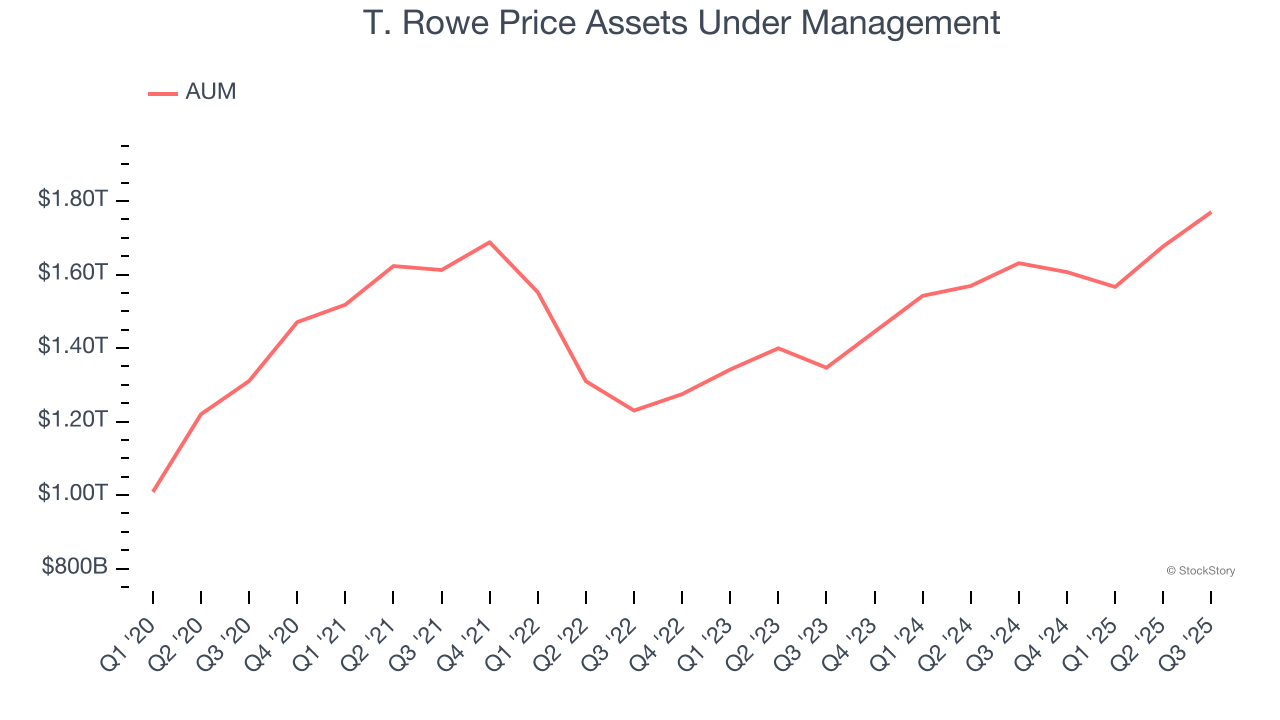
In Q3, T. Rowe Price’s AUM was $1.77 trillion, beating analysts’ expectations by 1.6%. This print was 8.5% higher than the same quarter last year.
Advisory, Servicing, and Other Fees
Fee income for financial institutions can come from specialized services such as M&A advisory, capital raising initiatives, and ongoing client support arrangements.
Over the past five years, T. Rowe Price’s fees grew by a weak 3.8% per year and tracked the change in its total revenue. A two-year view reveals a more encouraging story as growth picked up to 7.6% annualized.
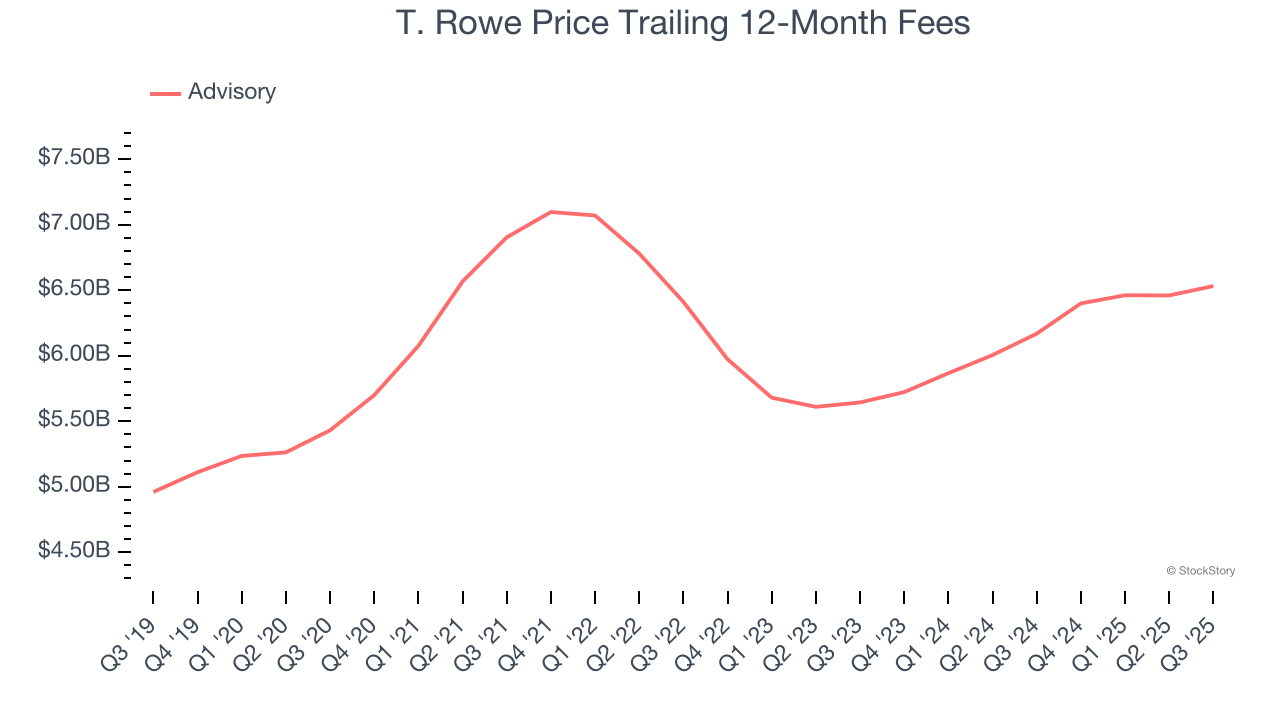
This quarter, T. Rowe Price’s fees were $1.70 billion, missing Consensus estimates by 0.6%. Wall Street opinions aside, fees grew by 4.4% year on year.
Key Takeaways from T. Rowe Price’s Q3 Results
It was good to see T. Rowe Price beat analysts’ EPS expectations this quarter. We were also happy its AUM outperformed Wall Street’s estimates. On the other hand, its advisory and servicing fees slightly missed. Overall, we think this was a solid quarter with some key areas of upside. The stock traded up 2.2% to $104.39 immediately following the results.
Indeed, T. Rowe Price had a rock-solid quarterly earnings result, but is this stock a good investment here? What happened in the latest quarter matters, but not as much as longer-term business quality and valuation, when deciding whether to invest in this stock. We cover that in our actionable full research report which you can read here, it’s free for active Edge members.